|
<< Click to Display Table of Contents >> R-2 Sales Reporting |
  
|
|
<< Click to Display Table of Contents >> R-2 Sales Reporting |
|
The following is a basic rundown or overview of the Sales reports available in Frazer. It is by no means meant to be an all-exhaustive list. Furthermore, reports often change over time as we receive feedback via our online portal (share an idea), customer feedback directly in our call center, and in conversations with those who run our Used Car Lot (for training purposes).
Index:
R-2-1 - Sales Totals
R-2-2 - Sales Listings
R-2-3 - Back End Sales Listings
R-2-4 - Sales Tax Report
R-2-5 - Cash Position Analysis
R-2-6 - Special Tax Report - (Only available in FL, IL, KS, LA, MA, MI, NJ, SC, TX, UT, VA, WI)
R-2-7 - Salesman Reporting
R-2-8 - Vehicles Evaluations by Profitability
R-2-9 - Lien Holder Analysis
R-2-0 - Zip Code Analysis
R-2-A - IRS/FinCEN Form 8300
R-2-B - Source of Customer Analysis
R-2-C - OFAC Names Checked
R-2-D - Government and Dealer Service Fees
R-2-E - Temporary Tag Log
R-2-F - Static Pool Analysis
R-2-G - Purchased Account Listing
R-2-H - Deposit Listing
R-2-I - Prospect Report
R-2-J - Recourse Buy Back Listing
R-2-K - Sales By Month
R-2-T - NIADA 20 Groups
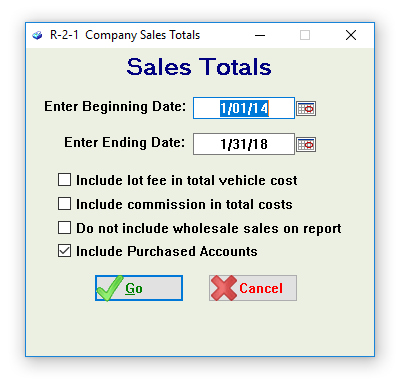
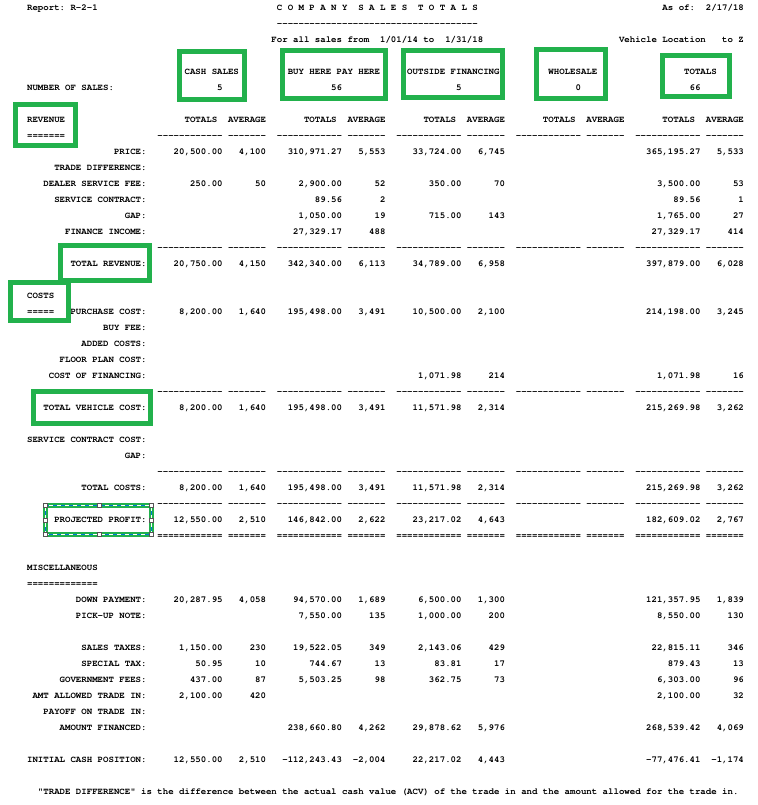
Reports → 2 - Sales Reporting → 1 - Sales Totals
The Sales Totals allows you to see you total number of sales in each of the four sales types and breaks down your revenue, costs, and projected profit. It can be run for set date ranges and can be valuable for month-end and year-end reporting.
When you first click Reports → 2. Sales Reporting → 1. Sales Totals, the next screen comes up.
A sample of the Sales Totals Report appears below:
Reports → 2 - Sales Reporting → 2 - Sales Listings
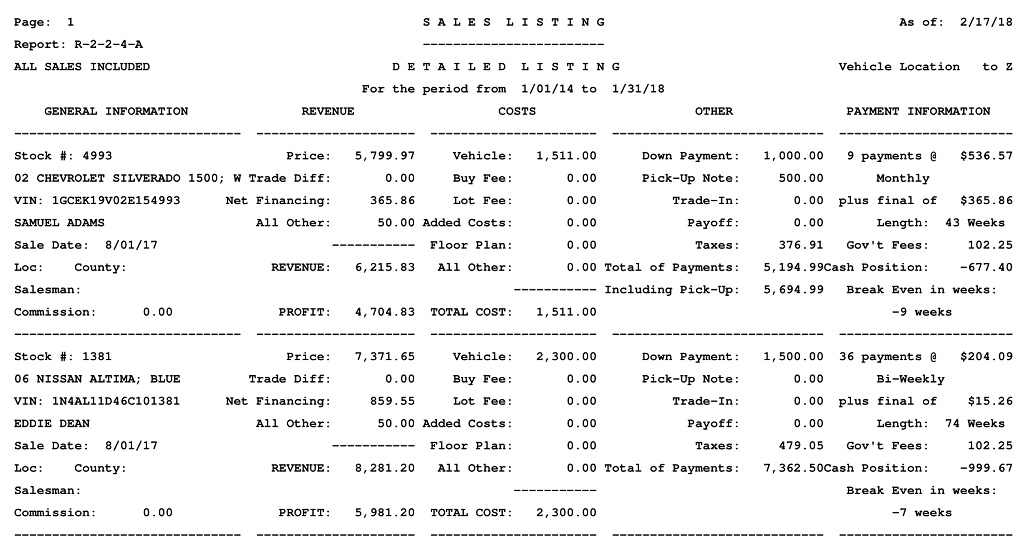
The Sales Listings allows you to review each of your sales in various levels of detail for a specified date range. The types of sales to be included may also be selected.
When you first click Reports → 2. Sales Reporting → 2. Sales Listings, the next screen comes up.
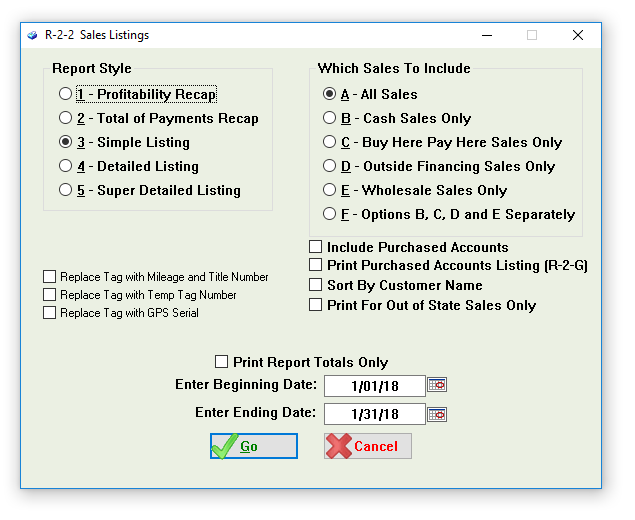
Note that if the Print Report Totals Only box is checked, the report will only show the totals and averages of all your sales. If the box is left unchecked you will see details on each sale, with totals and averages at the end.
A sample of the Sales Listings → Detailed Listing Report appears below:
Reports → 2 - Sales Reporting → 3 - Back End Sales Listings
The Sales Listings allows you to review sales of back end products such as GAP, VSI, and Service Contracts. The types of back end products to be included may also be selected.
When you first click Reports → 2. Sales Reporting → 3. Back End Sales Listings, the next screen comes up.
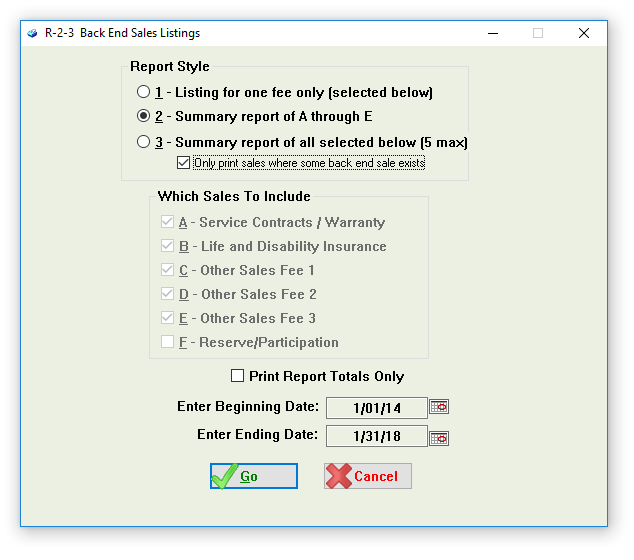
Note that if the Print Report Totals Only box is checked, the report will only show the totals and averages of all your back end sales. If the box is left unchecked you will see details of back end products sold on each sale, with totals and averages at the end.
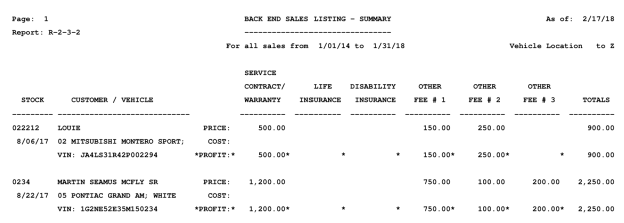
A sample of the Back End Sales Listings Report appears below:
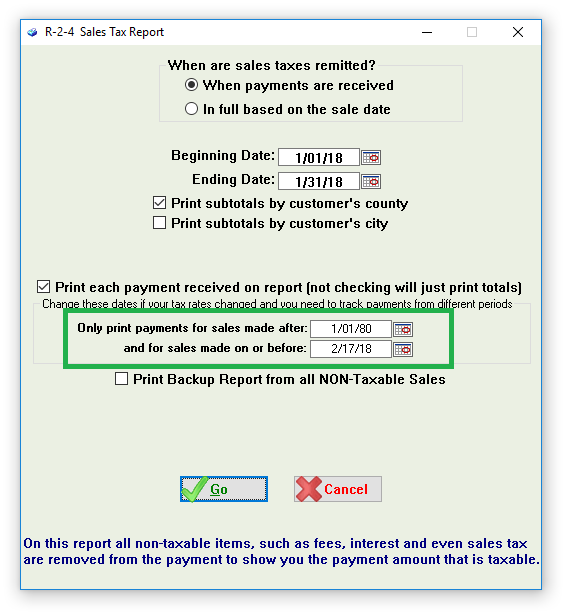
Reports → 2 - Sales Reporting → 4 - Sales Tax Report
The Sales Tax Report allows you to review the payments that you have received and the amount of each payment that is tax. If you have county, city, or other taxes those are separated out on the report. The sum total of the taxes may be found at the end of the report.
When you first click Reports → 2. Sales Reporting → 4. Sales Tax Report, the next screen comes up.
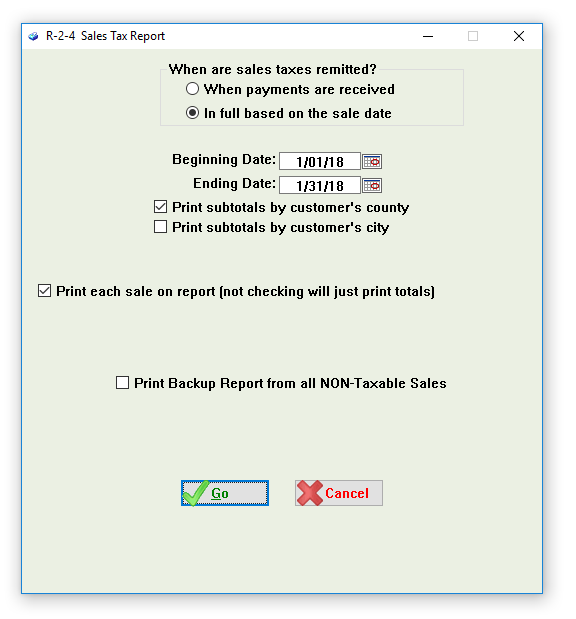
If your state allows for deferred taxes, an option to select that you pay tax that way is found on the report. In this case, it is important to make sure that you have set the date range for sales made to be inclusive in addition to the date range of payments received. An example of Reports → 2. Sales Reporting → 4. Sales Tax Report in which deferred taxes are allowed appears below:
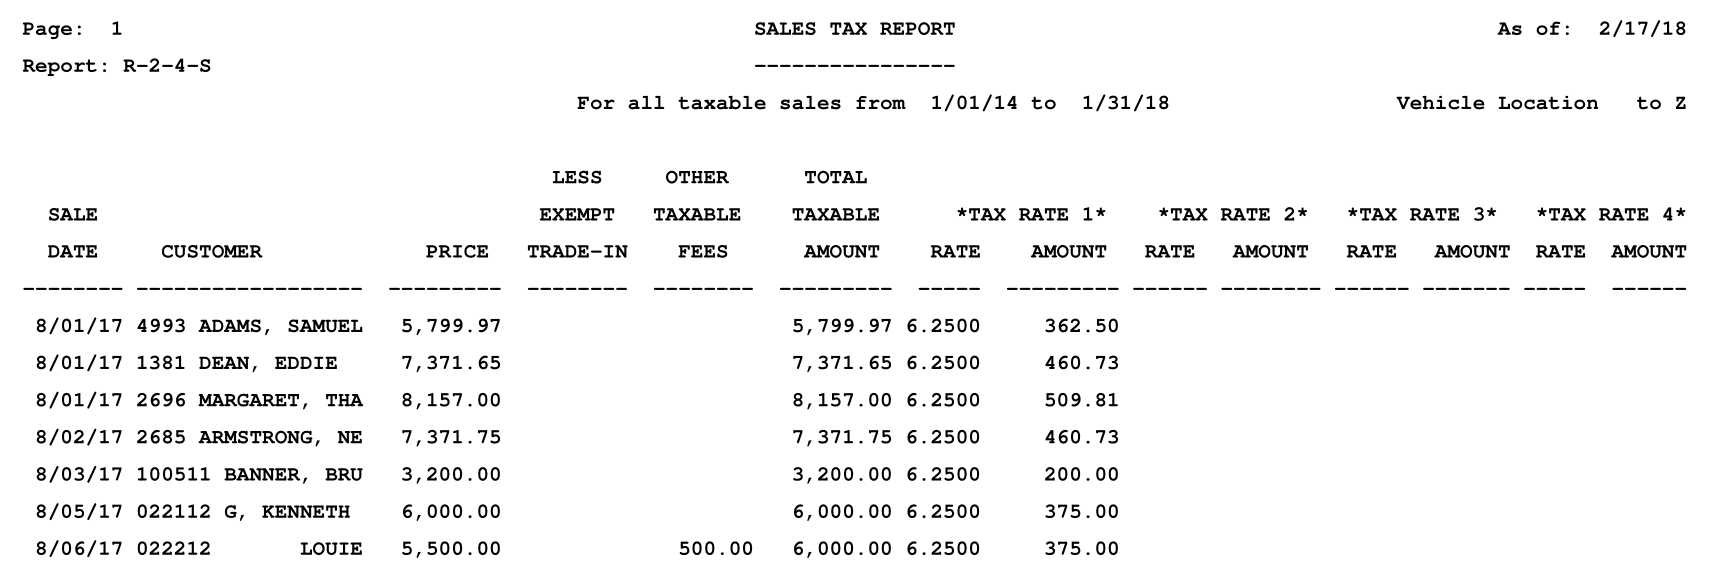
A sample of the Sales Tax Report appears below:
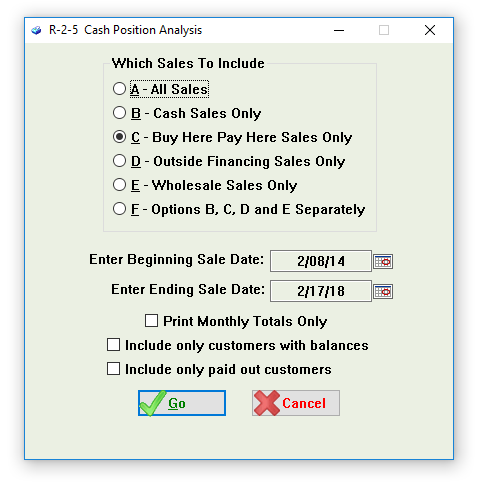
Reports → 2 - Sales Reporting → 5 - Cash Position Analysis
The Cash Position Analysis presents the original and current cash position as well as the balance remaining on your sales. This report is often referred to as the “Cash on the street” report. This report can be run for all sales types, but is very valuable for buy here pay here sales.
When you first click Reports → 2. Sales Reporting → 5. Cash Position Analysis, the next screen comes up.
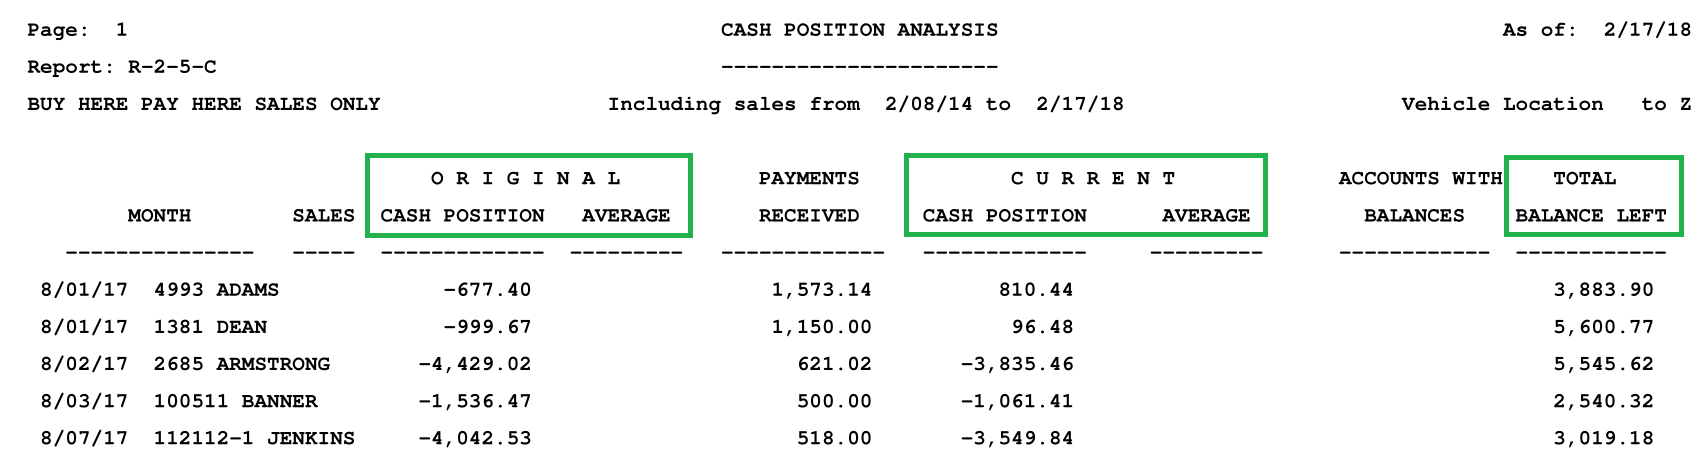
A sample of the Cash Position Analysis → Buy Here Pay Here Sales Only Report appears below:
Reports → 2 - Sales Reporting → 6 - State Specific Report
This report is state specific and has been created to provide Frazer users the ability to generate a report that will aid them in complying with state laws. If you have questions about this report for your state contact Frazer at 888-963-5369.
The following states have R-2-6 reports:
Texas
Florida
Virginia
Kansas
Louisiana
New Jersey
South Carolina
Utah
Illinois
Massachusetts
Michigan
Wisconsin
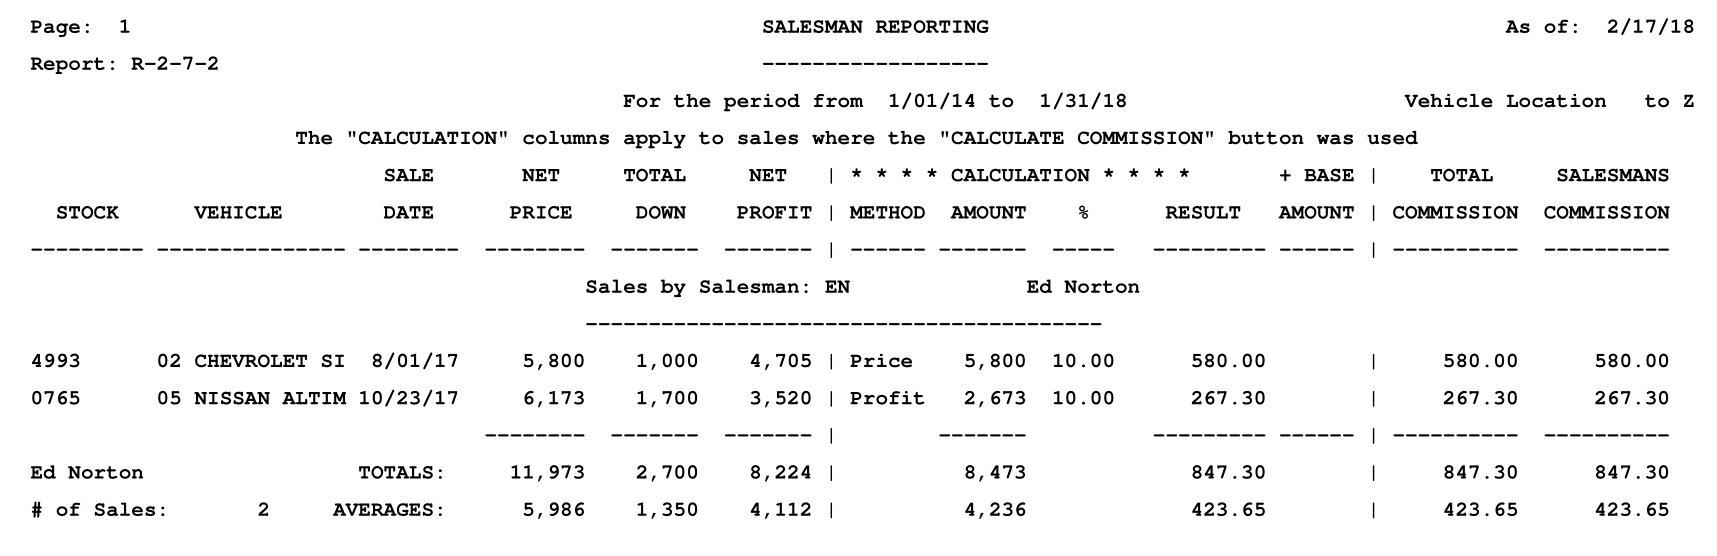
Reports → 2 - Sales Reporting → 7 - Salesman Reporting
The Salesman Reporting report presents the number of sales each salesman has made and the commission earned on each sale.
When you first click Reports → 2. Sales Reporting → 7. Salesman Reporting, the next screen comes up.
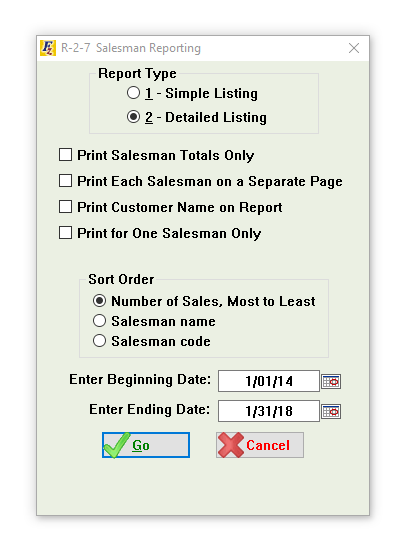
A sample of the Salesman Reporting Report appears below:
Reports → 2 - Sales Reporting → 8 - Vehicle Evaluations by Profitability
The Vehicle Evaluations by Profitability report presents the profit made on the sales of vehicles by specific vehicle items such as make, model, age, vendor, and more. In addition to contractual profit, profit per day on lot and realized profit is presented.
When you first click Reports → 2. Sales Reporting → 8. Vehicle Evaluations by Profitability, the next screen comes up.
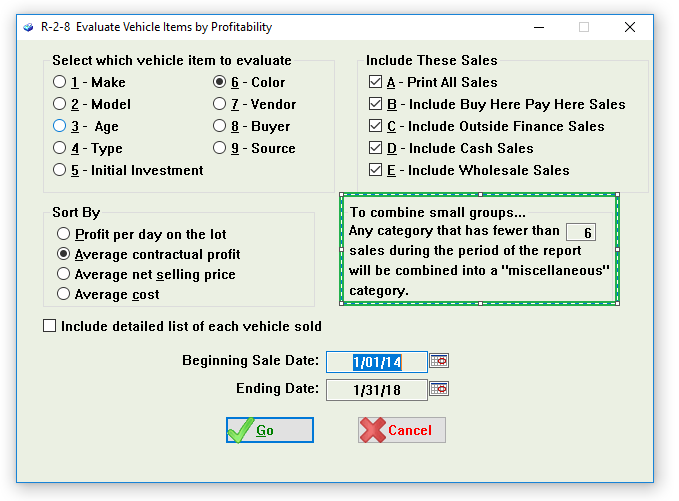
Note that there is an option to combine small groups. Making this number lower will allow items with fewer sales to be presented individually.
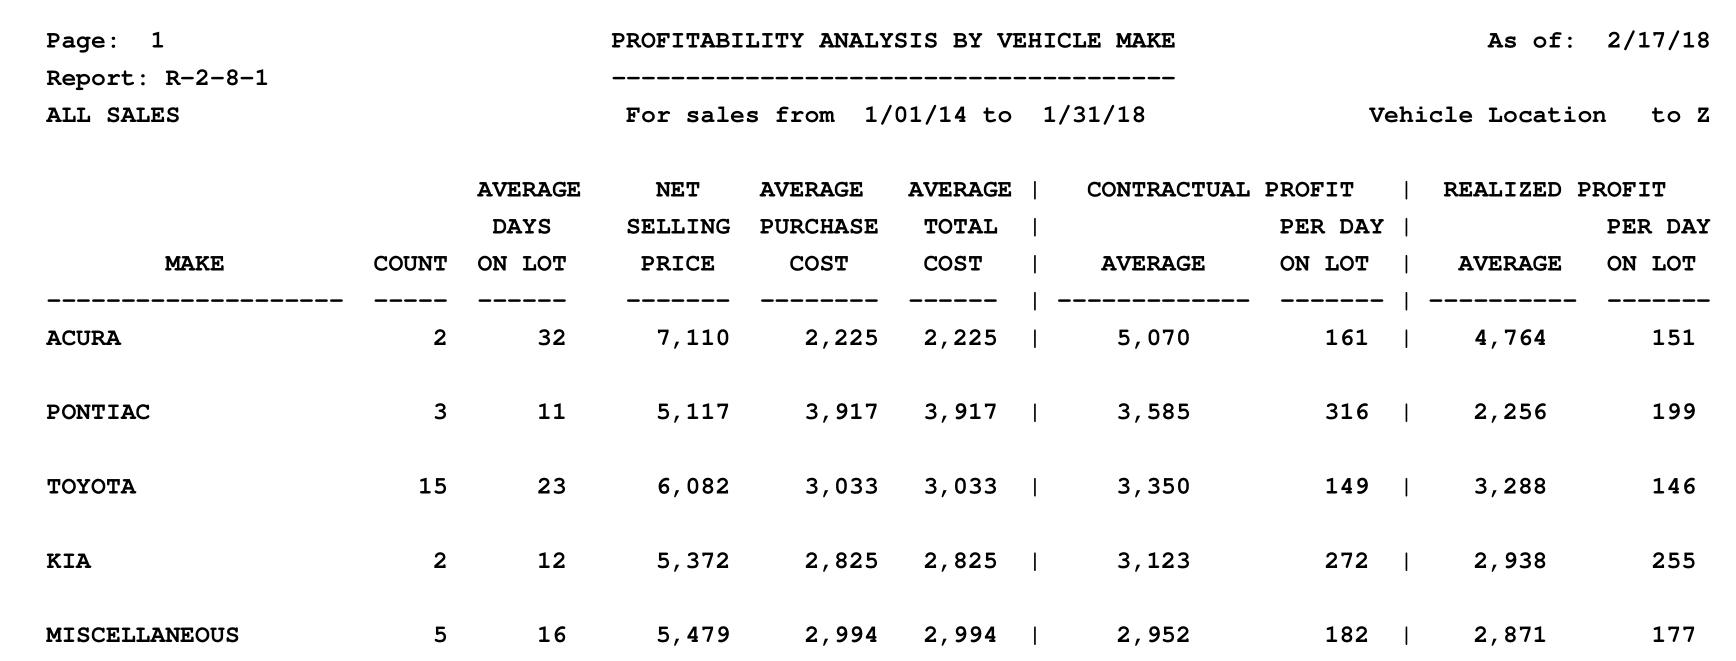
A sample of the Vehicle Evaluations by Profitability → Make → Sorted by Contractual Profit Report appears below:
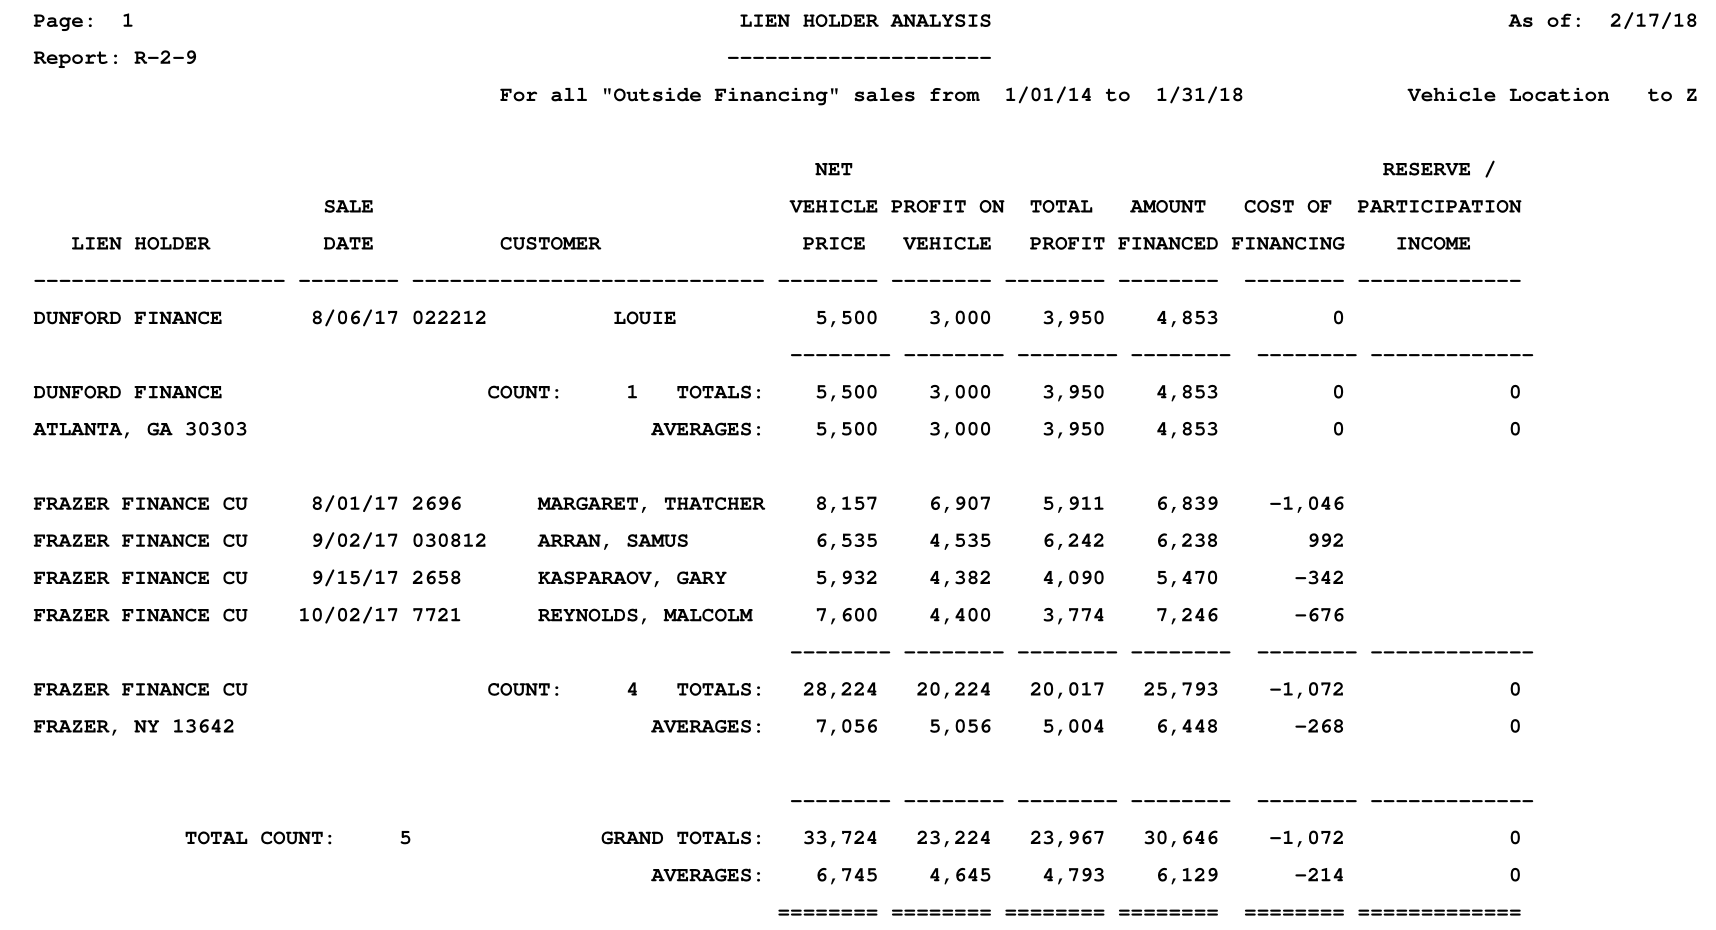
Reports → 2 - Sales Reporting → 9 - Lien Holder Analysis
The Lien Holder Analysis report presents information on your outside financing sales sorted by the lien holder. Profit, cost of finance, and reserve/participation income is itemized on this report.
When you first click Reports → 2. Sales Reporting → 9. Lien Holder Analysis, the next screen comes up.
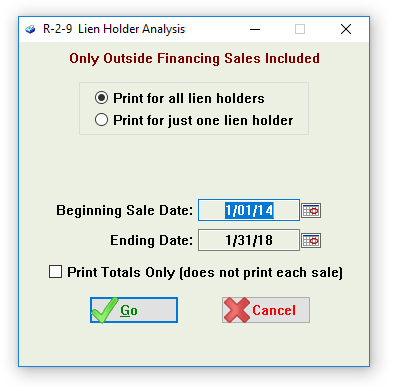
Note that if the Print Totals Only box is checked, the report will only show the totals and averages for each lien holder.
A sample of the Lien Holder Analysis Report appears below:
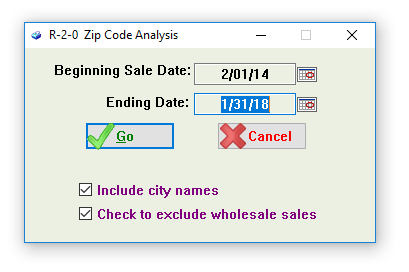
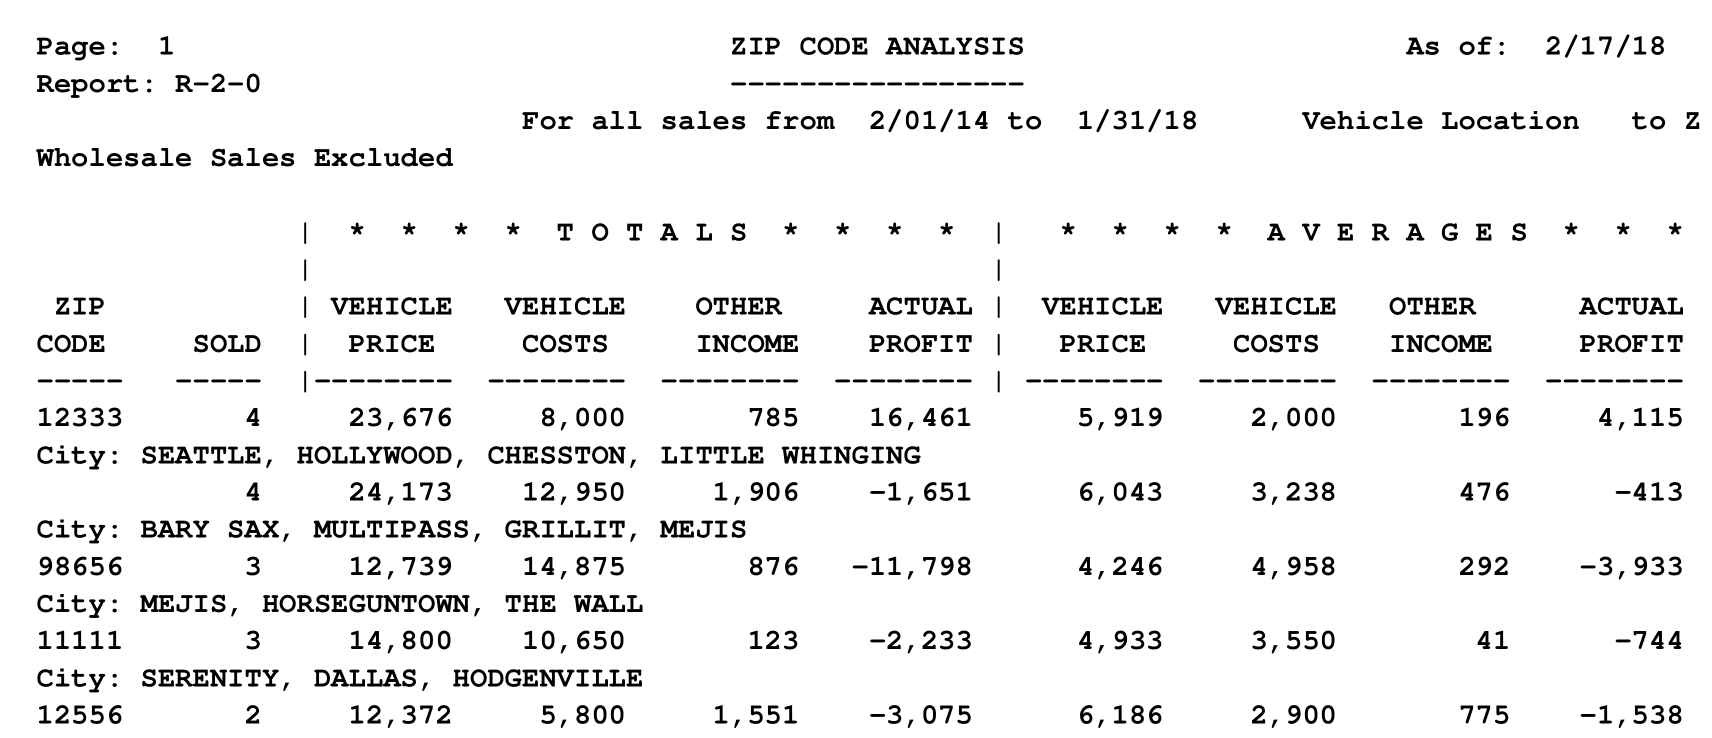
Reports → 2 - Sales Reporting → 0 - Zip Code Analysis
The Zip Code Analysis report reveals the number of sales per customers zip code and the profitability of those sales.
When you first click Reports → 2. Sales Reporting → 0. Zip Code Analysis, the next screen comes up.
A sample of the Lien Holder Analysis Report appears below:
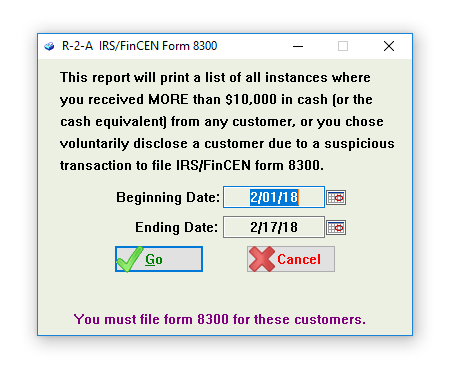
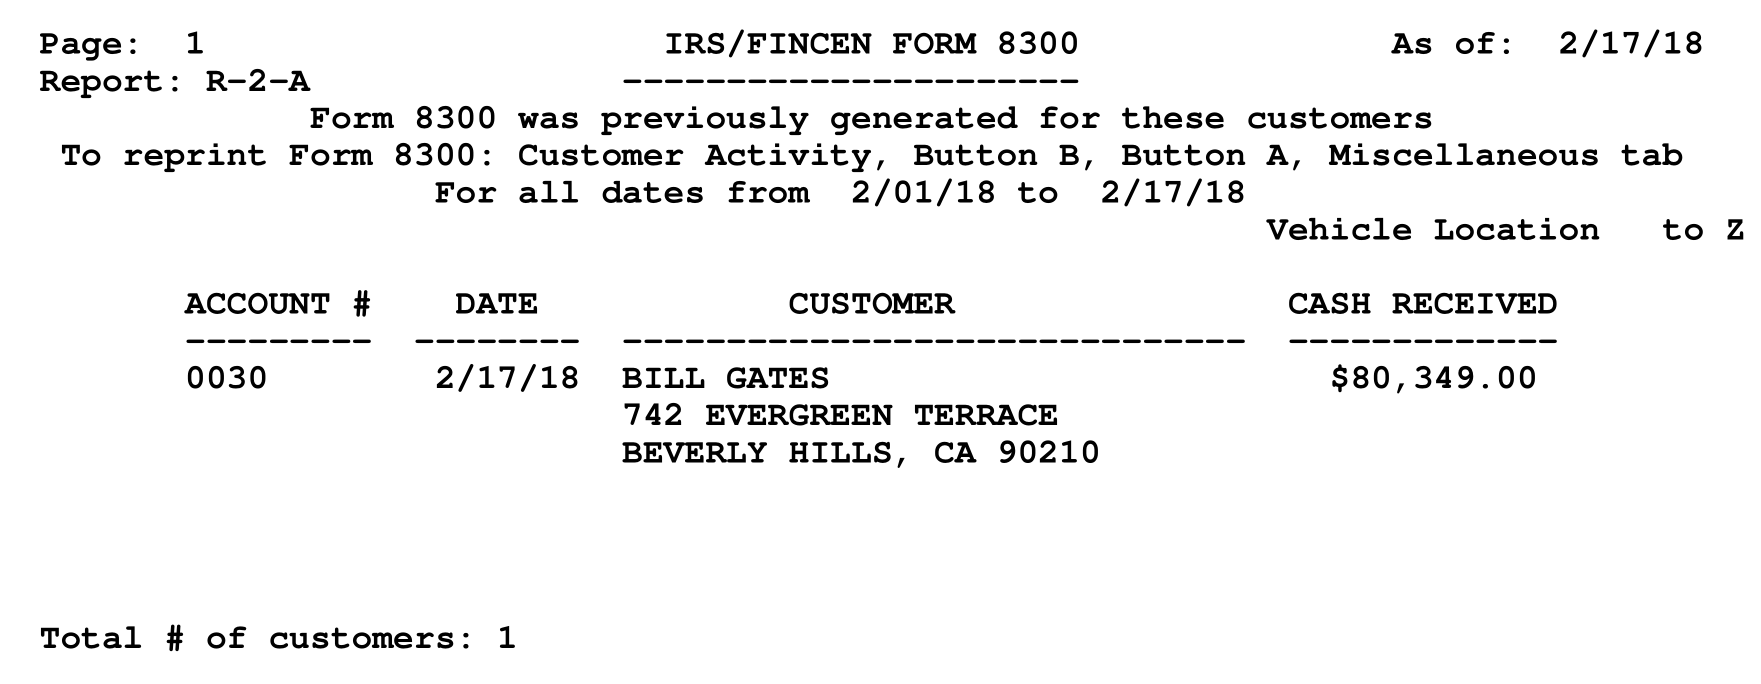
Reports → 2 - Sales Reporting → A - IRS/FinCEN Form 8300
The IRS/FinCEN Form 8300 report shows the customers for whom a Form 8300 was printed. A Form 8300 is printed for any customer from whom you have received more than $10,000 in funds that can’t be traced.
When you first click Reports → 2. Sales Reporting → A. IRS/FinCEN Form 8300, the next screen comes up.
A sample of the Lien Holder Analysis Report appears below:
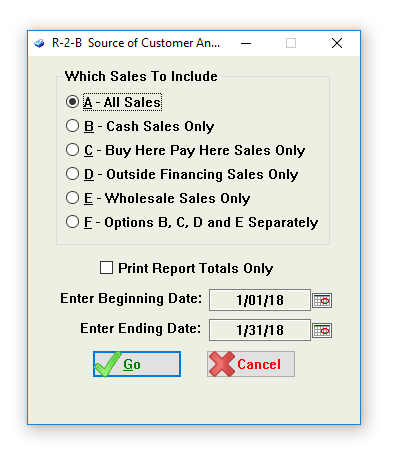
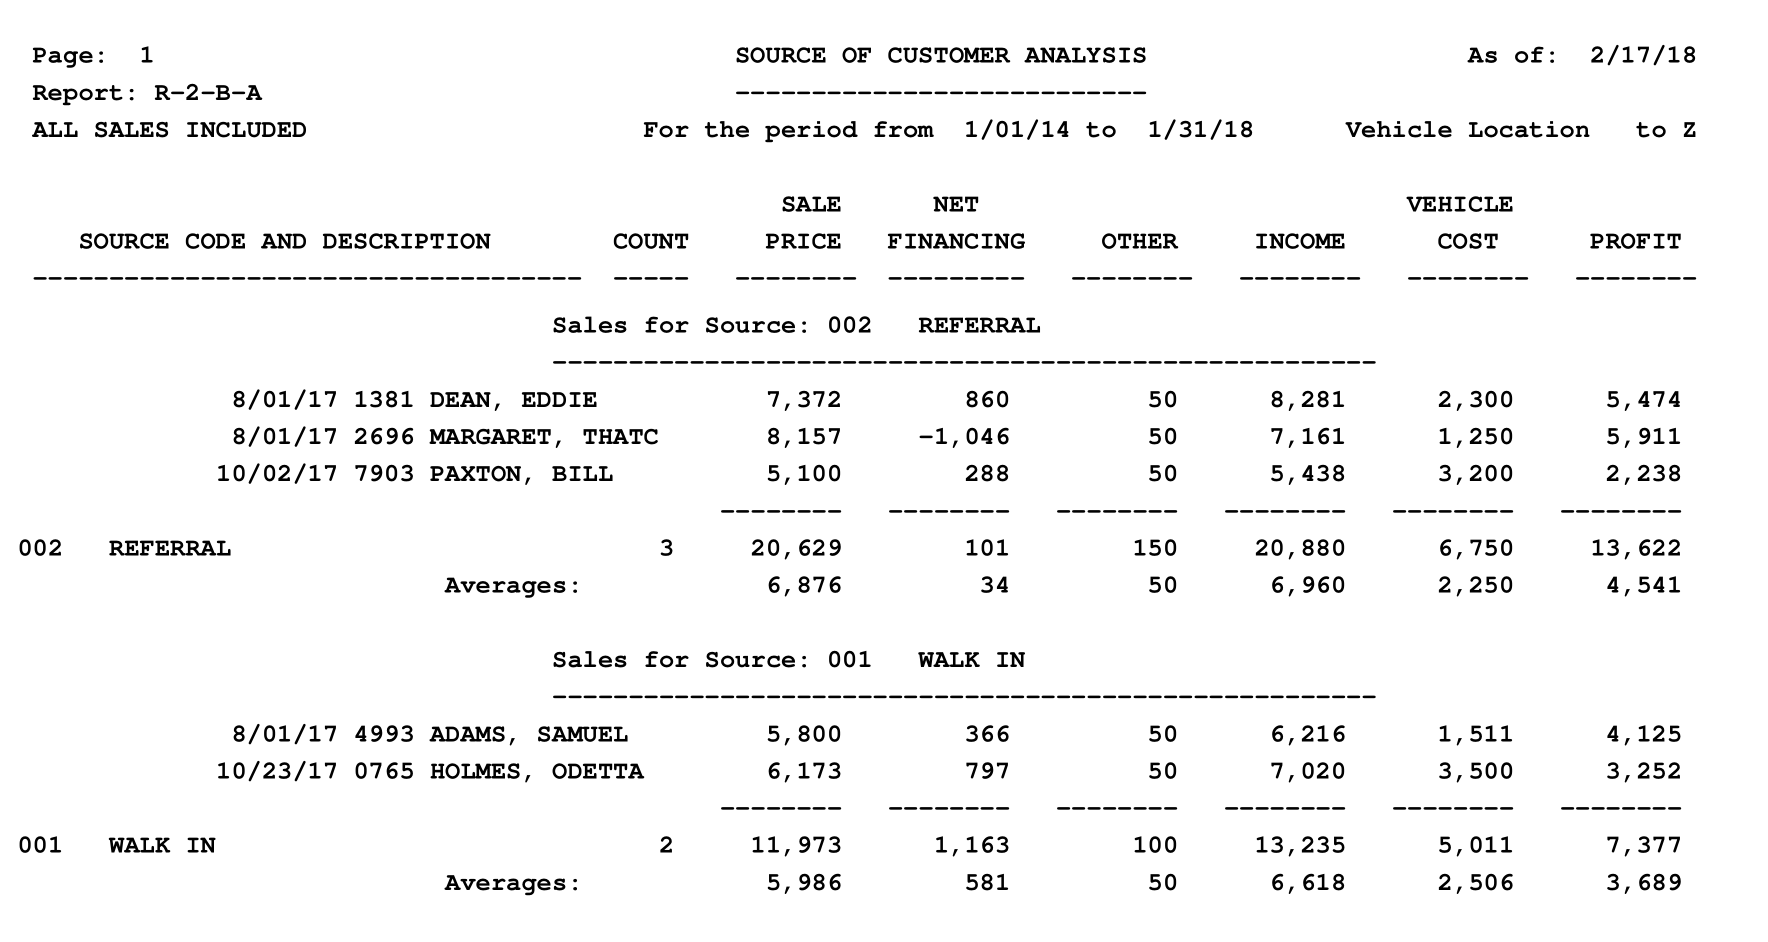
Reports → 2 - Sales Reporting → B - Source of Customer Analysis
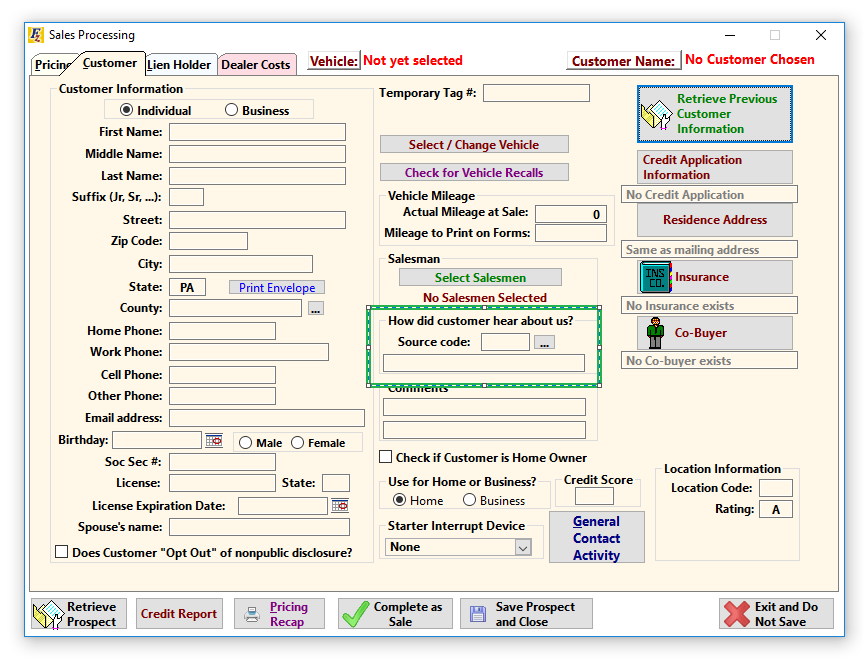
The Source of Customer Analysis allows you to see how your customers are hearing about you. This information is entered on the Customer tab of the Sales window.
When you first click Reports → 2. Sales Reporting → B. Source of Customer Analysis, the next screen comes up.
Note that if the Print Totals Only box is checked, the report will only show the total number of sales for each source code.
A sample of the Source of Customer Analysis Report appears below:
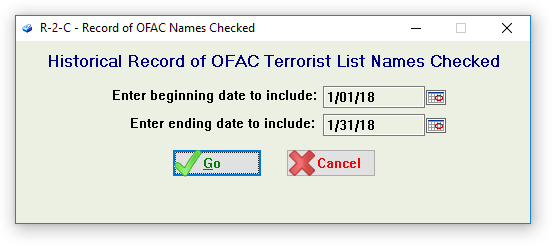
Reports → 2 - Sales Reporting → C - OFAC Names Checked
The OFAC Names Checked report shows all names checked against the U.S. Treasury Department’s Office of Foreign Assets Control. The list is called the Specially Designated Nationals and Blocked Person’s list. Frazer will automatically check the list every time you enter a sale or take a payment. It is your responsibility to assure that if you do business with a person who has their name on the list, that you have verified that your customer is not actually the individual the government put on the list. You may look at Sales → 8. OFAC’s SDN List (Terrorist List) to see the names on the list.
When you first click Reports → 2. Sales Reporting → C. OFAC Names Checked, the next screen comes up.
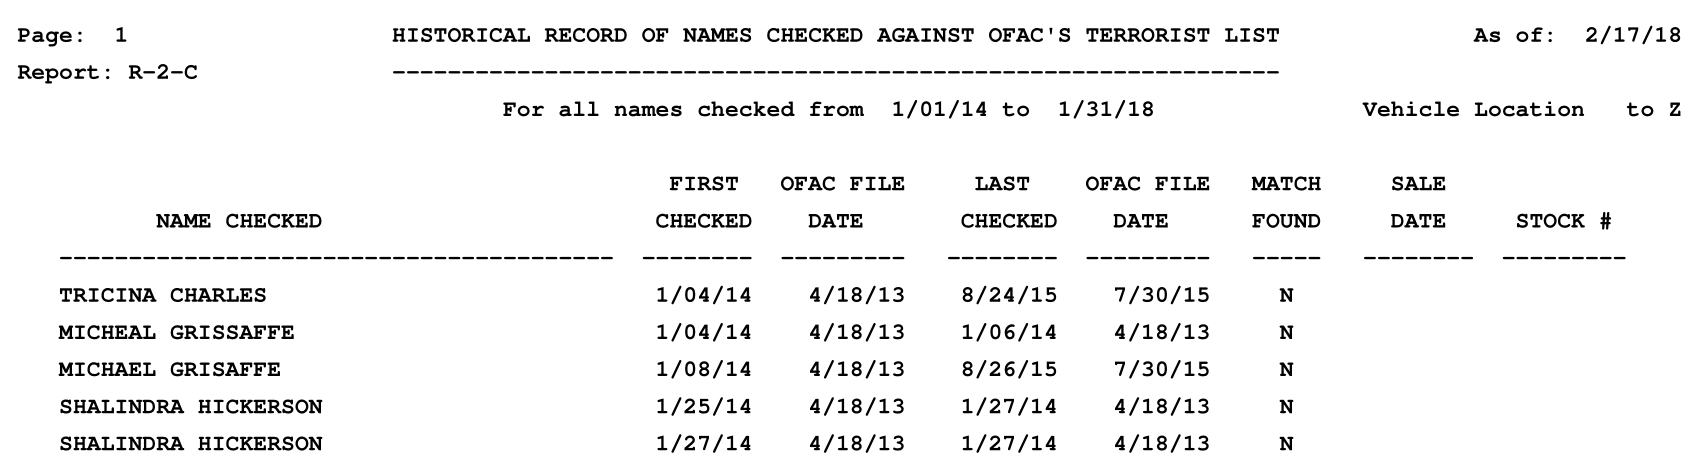
A sample of the OFAC Names Checked Report appears below:
Reports → 2 - Sales Reporting → D - Government and Dealer Service Fees
The Government and Dealer Service Fees report shows the dealer service fee and total of government fees charged to each customer. The report can be run for all fees, or a specific fee.
When you first click Reports → 2. Sales Reporting → D. Government and Dealer Service Fees, the next screen comes up.
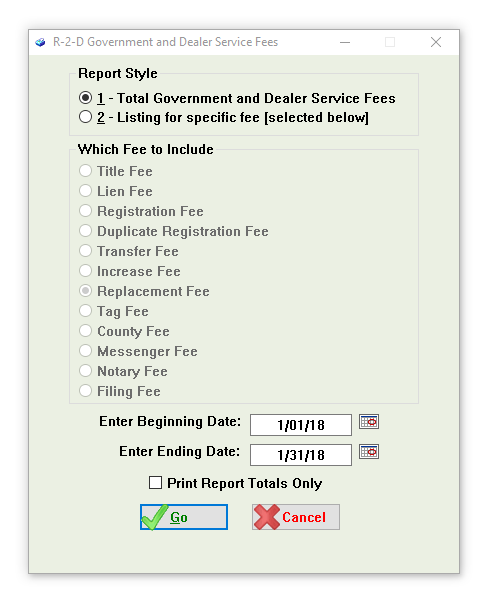
Note that if the Print Totals Only box is checked, the report will only show the sum of the dealer service fees and total government fees.
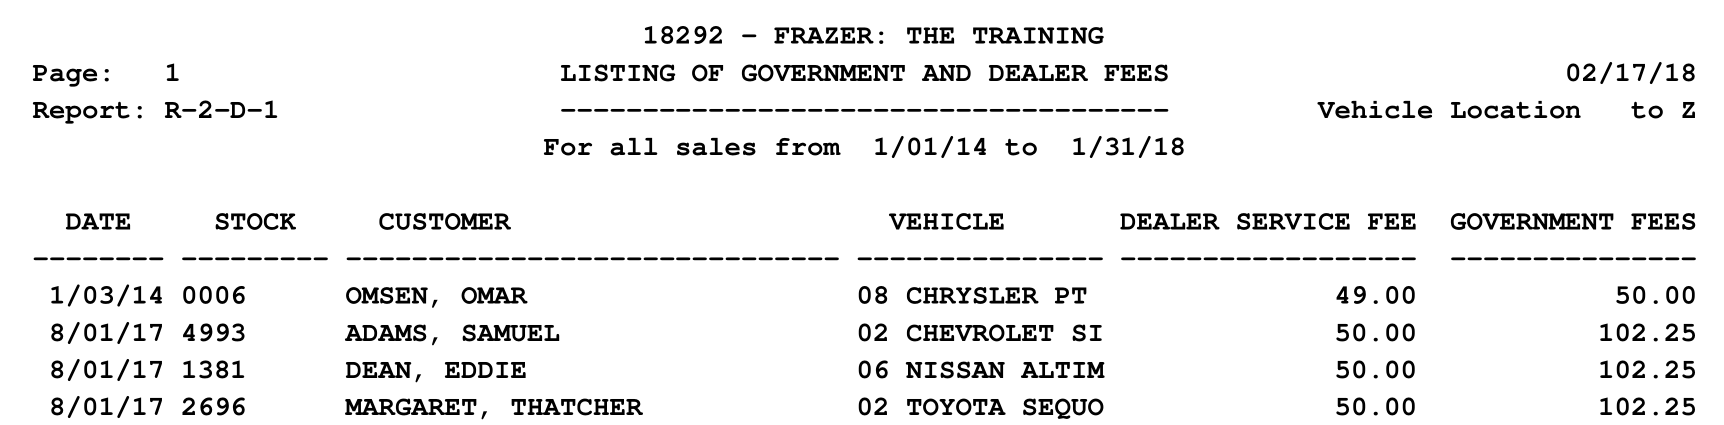
A sample of the Government and Dealer Service Fees Report appears below:
Reports → 2 - Sales Reporting → E - Temporary Tag Log
The Temporary Tag Log report shows temporary tags that were assigned to each sale. It may be run for a date range or range of tag numbers. A temporary tag is logged on the Customer tab of the Sales screen.
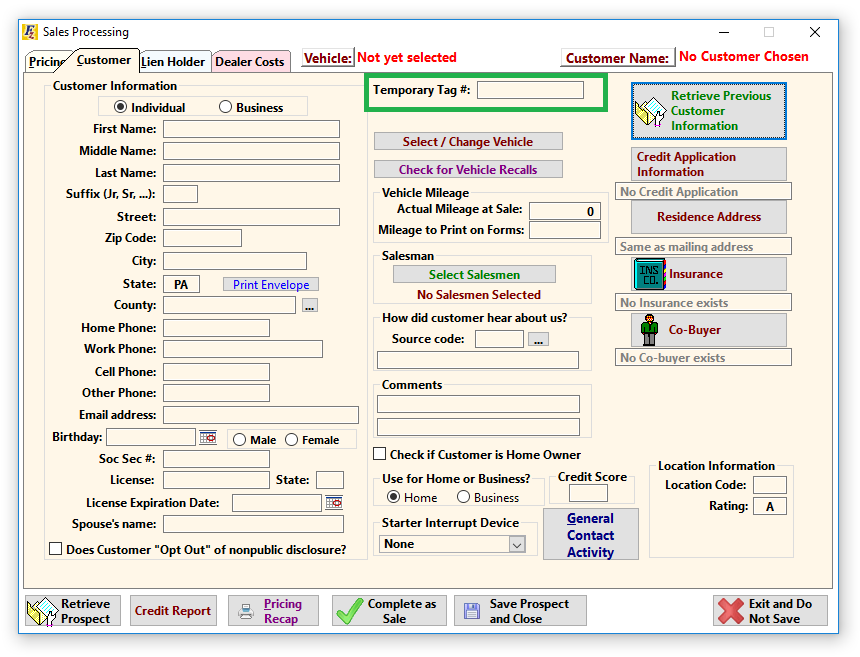
When you first click Reports → 2. Sales Reporting → E. Temporary Tag Log, the next screen comes up.
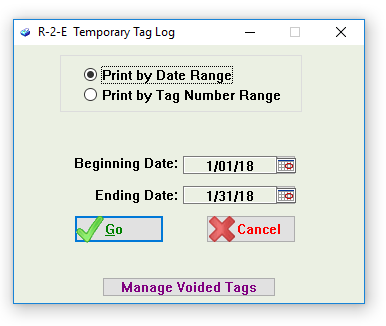
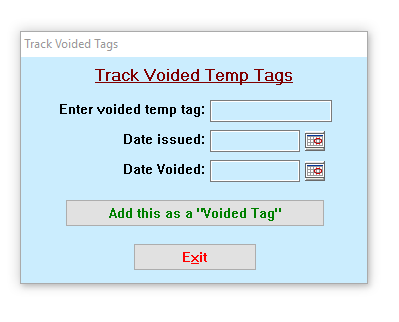
If you click Manage Voided Tags you are able to enter the voided date for applicable tags.
For a more comprehensive breakdown of how Temp Tags work, click here.
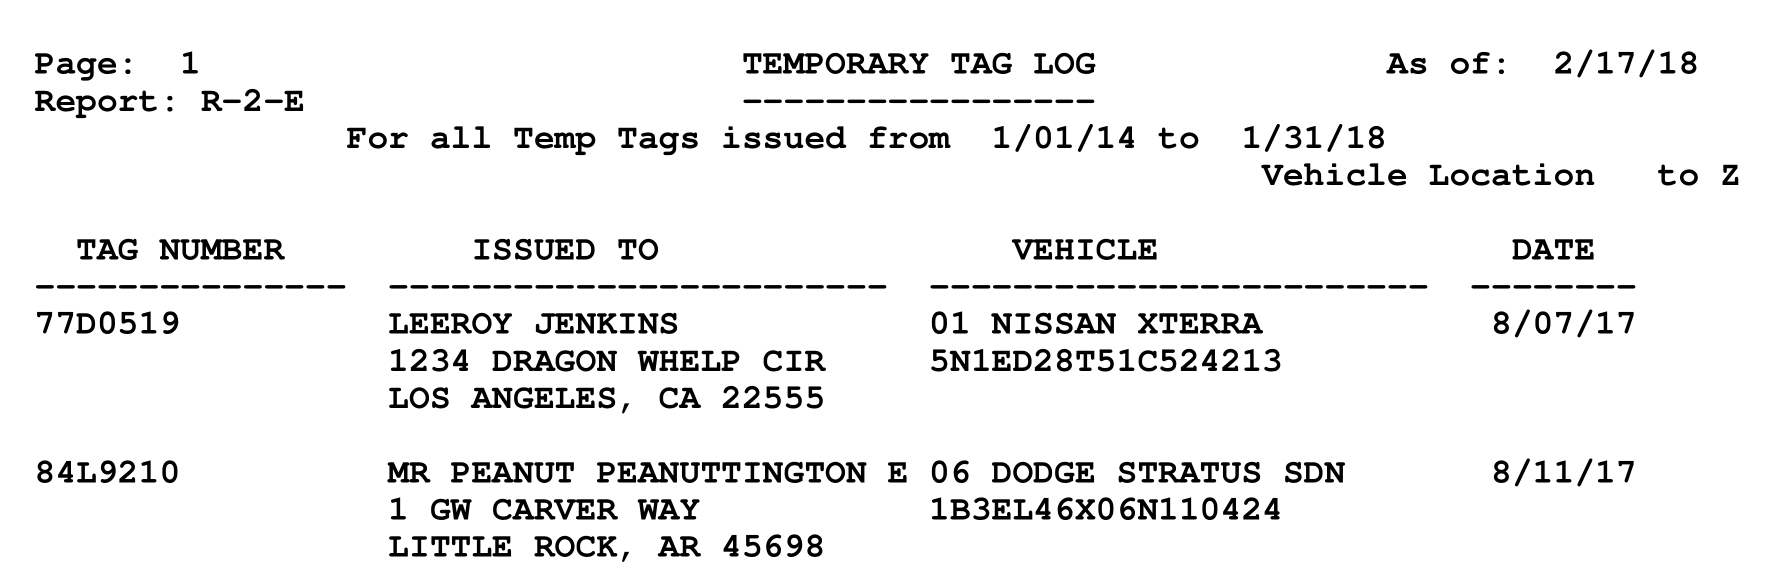
A sample of the Temporary Tag Log Report appears below:
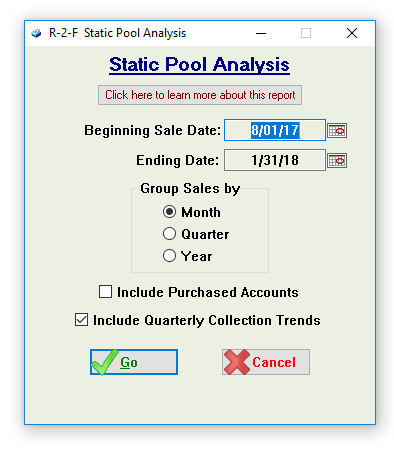
Reports → 2 - Sales Reporting → F - Static Pool Analysis
The Static Pool Analysis report shows what percentage of principal you have collected on your buy here pay here sales, and what percent of your sales end up being written off. It can be run by date range to assess the performance of your buy here pay here accounts.
When you first click Reports → 2. Sales Reporting → F. Static Pool Analysis, the next screen comes up.
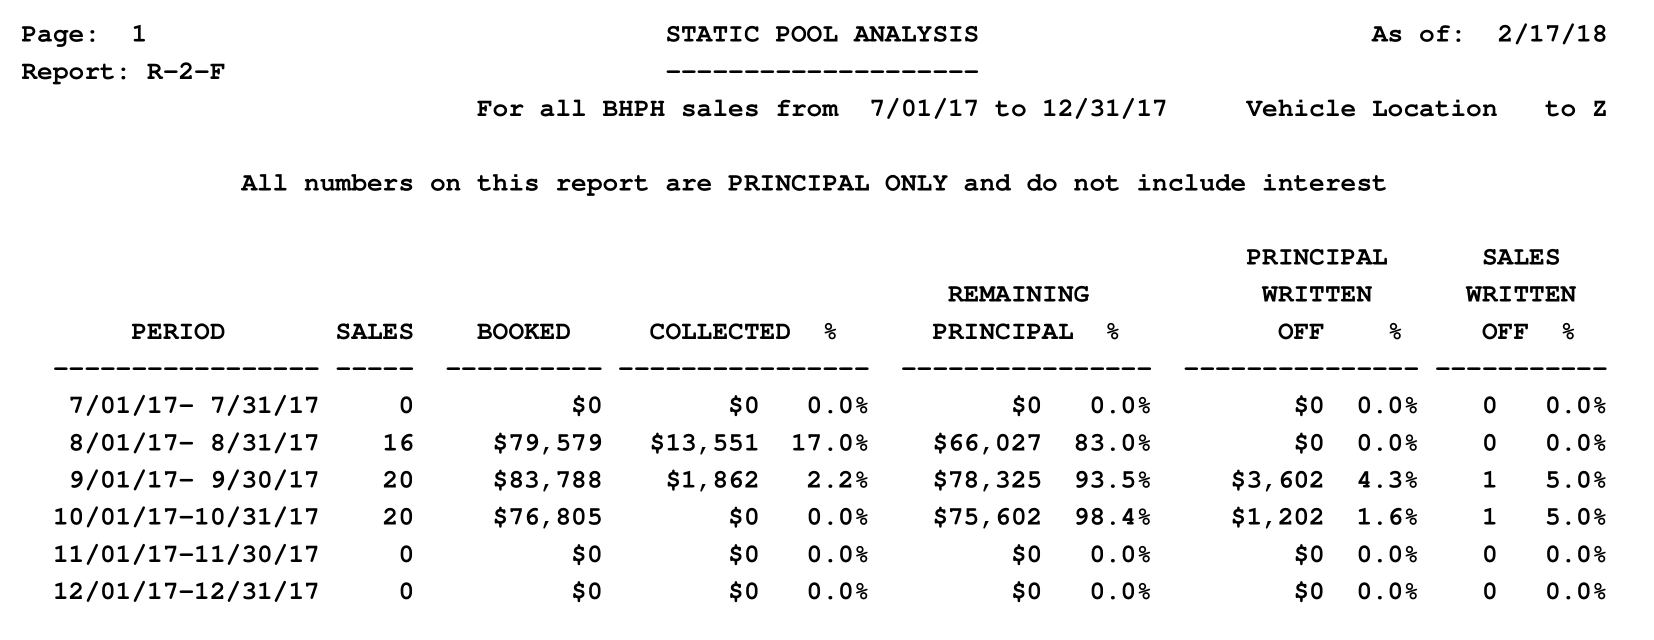
A sample of the Static Pool Analysis Report appears below:
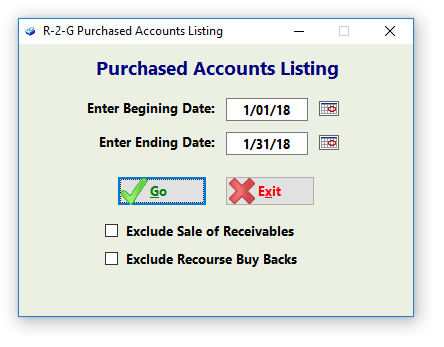
Reports → 2 - Sales Reporting → G - Purchased Account Listing
The Purchased Account Listing report will present basic information for accounts that you have entered into Frazer as purchased customers.
When you first click Reports → 2. Sales Reporting → G. Purchased Account Listing, the next screen comes up.
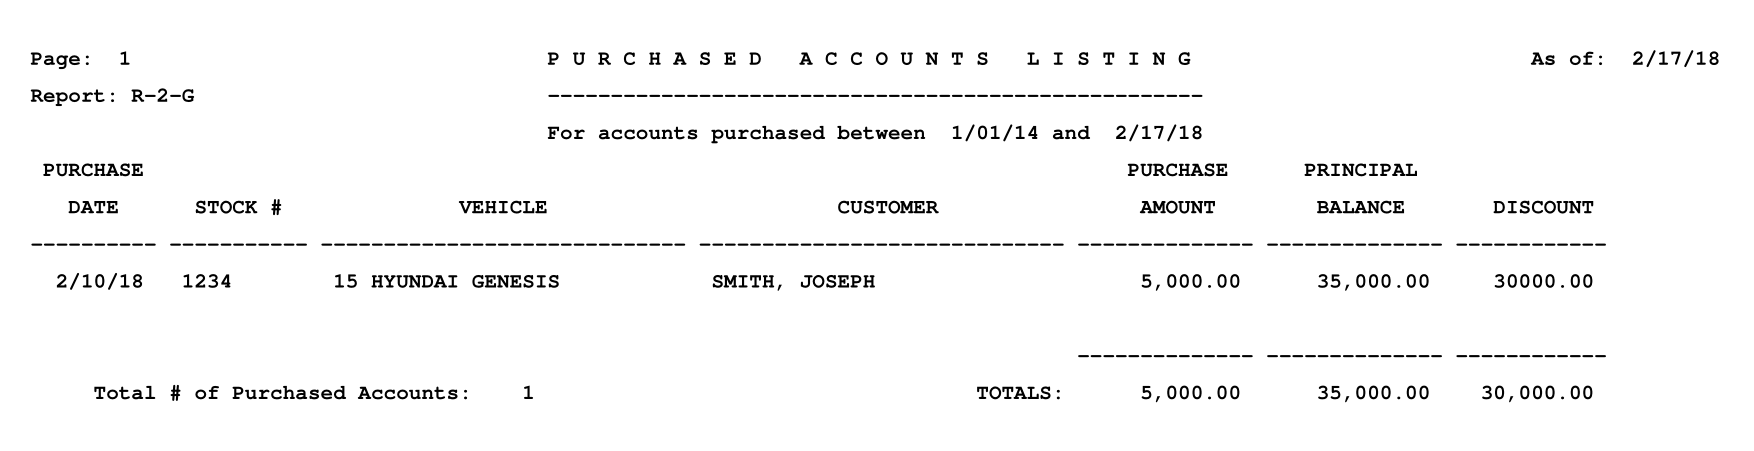
A sample of the Purchased Account Listing Report appears below:
Reports → 2 - Sales Reporting → H - Deposit Listing
The Deposit Listing report will allow you to look at all deposits you have taken and may be specified by their status.
When you first click Reports → 2. Sales Reporting → H. Deposit Listing, the next screen comes up.
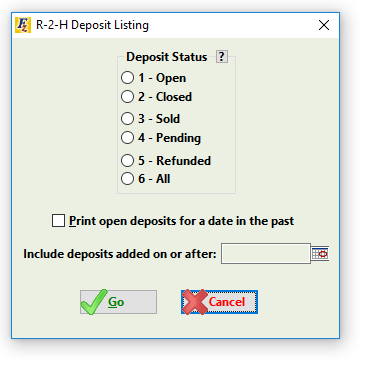
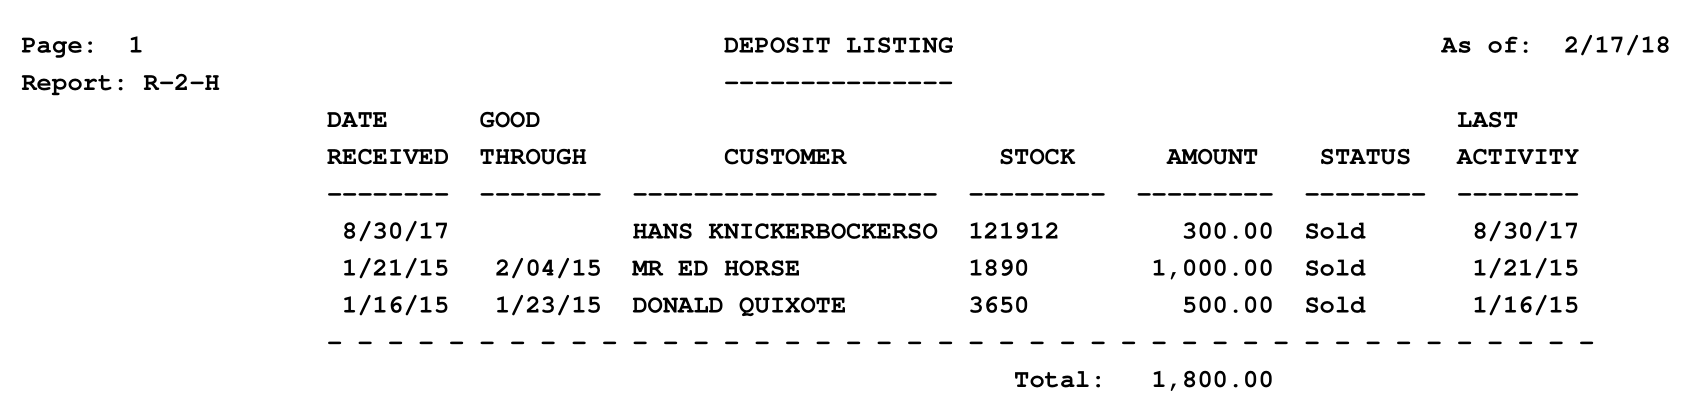
A sample of the Deposit Listing Report appears below:
Reports → 2 - Sales Reporting → I - Prospect Report
The Prospect Report shows all prospects within the selected date range.
When you first click Reports → 2. Sales Reporting → I. Prospect Report, the next screen comes up.
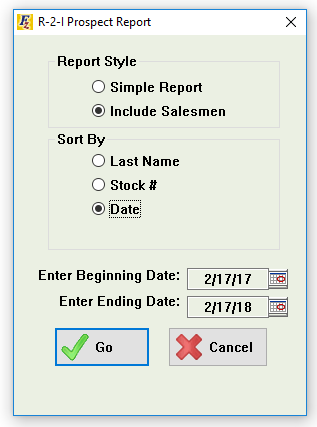
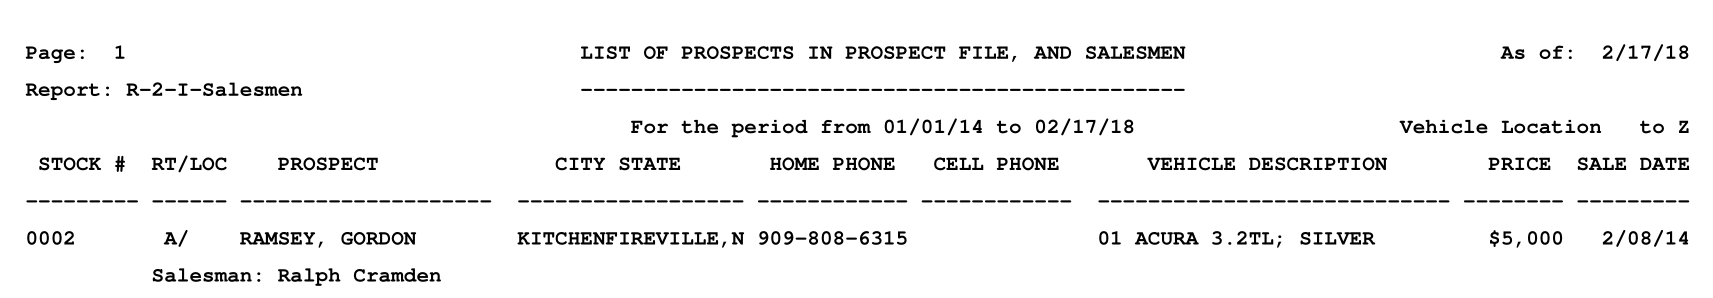
A sample of the Prospect Report appears below:
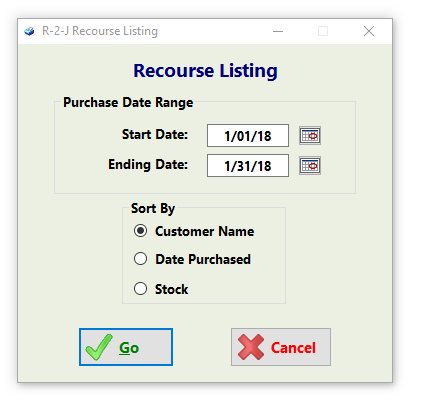
Reports → 2 - Sales Reporting → J - Recourse Buy Back Listing
The Recourse Buy Back Listing report shows those customers that had been sold as receivables, but were subsequently purchased back.
When you first click Reports → 2. Sales Reporting → J. Recourse Buy Back Listing, the next screen comes up.
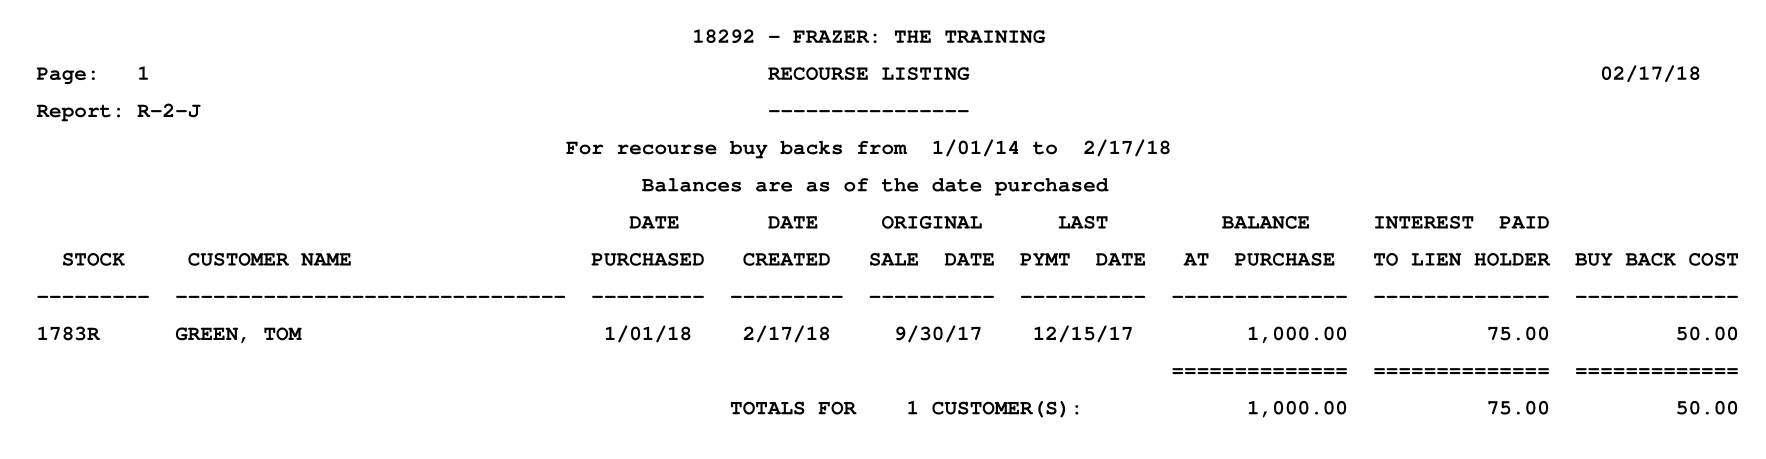
A sample of the Recourse Buy Back Listing Report appears below:
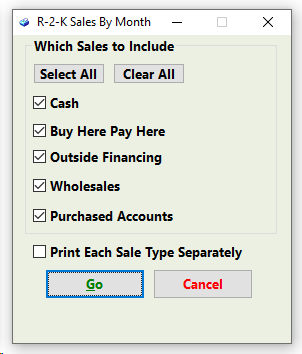
Reports → 2 - Sales Reporting → K - Sales By Month
The "Sales by Month" report will give you an at a glance total for your sales since you started using Frazer. Hopefully they've steadily increased! ;)
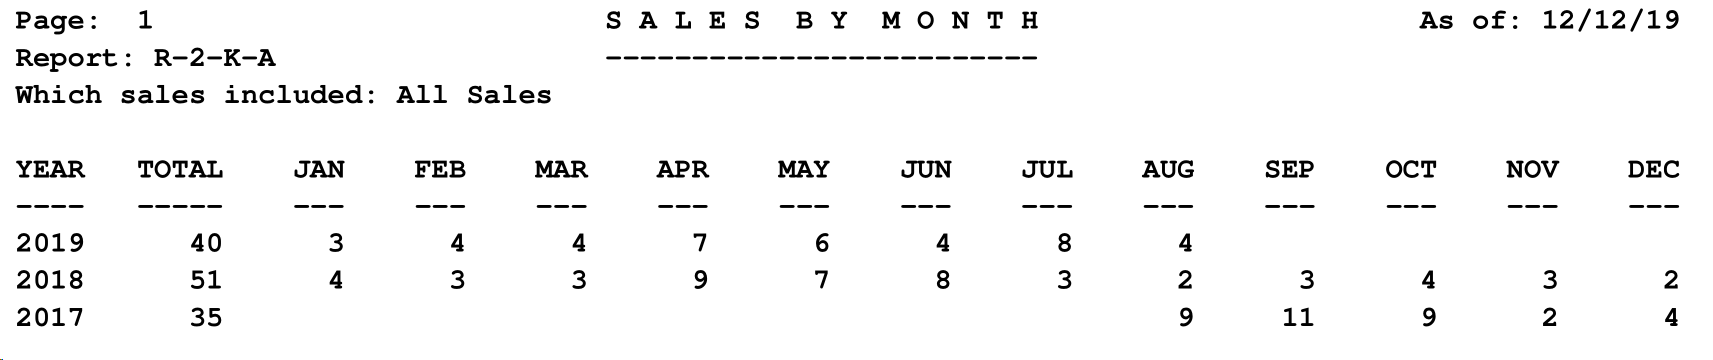
A sample of the Sales by Month report is shown below:
Reports → 2 - Sales Reporting → T - NIADA 20 Groups
You may not have realized that Frazer Computing has their own dealership that the company uses for beta testing and research. Well, Frazer does! And, as part of that, Frazer Motors is also signed up with a 20 Group. To learn more about 20 groups, please visit the NIADA's website. This report has been designed with the "reports requirements" of the 20 groups in mind.
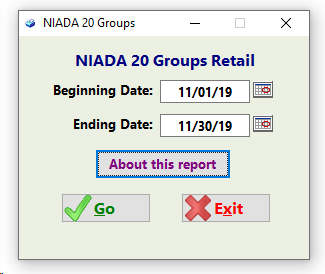
Because this report goes for several pages, to view a sample of the report, just navigate to the report and run it.